Student Survey Results 2013-2016
Written by: Dr. Christine von Renesse and Dr. Volker Ecke
We have long believed that our students enjoyed working on challenging mathematical problems and that after taking our classes they could find mathematics to be beautiful. However, we needed more than anecdotal evidence of this. Data from surveys administered from 2013-2016 provide evidence that our curriculum materials and our pedagogical tools have a significant impact on our students.
Mathematics:
After taking our classes, students know more about what it means to do mathematics, who mathematicians are, and what they might feel. Students find mathematics more interesting and enjoy working on challenging mathematical problems and making discoveries. They find mathematics more beautiful and perceive an increased ability to understand and critique written or spoken mathematical arguments.
General Education:
Students report that their ability to communicate and reason effectively has increased and that they feel more empowered as learners. Their curiosity about the world around them has increased, as has their confidence in taking responsibility for their own learning.
Key Findings:

Our project has been working on evaluating the effectiveness of our materials and teaching techniques for many years, you can read the full story of our strategies and attempts in the story of our evaluation. In this blog we describe the results of analyzing matched pre/post survey data from about 450 students, 2013-2016 that measure students' beliefs and attitudes. We are glad to report that students beliefs and attitudes changed in the desired direction for all questions. In addition, many changes are significant and have effect sizes above 0.4 . Specifically, there are 46 questions where it makes sense to compute effect sizes. Out of those, more than 40% show medium or strong effect sizes (larger than 0.4). An additional 40% show weak effect sizes (between 0.2 and 0.4) , and less than 20% show smaller effect sizes (below 0.2).
Our 11 goals for student change were grouped into four larger categories. Here are the key findings for each category with significance levels of p<.0001 and effect sizes in the matched data of at least 0.4:
Understanding the Field of Mathematics (Goals 1-4)
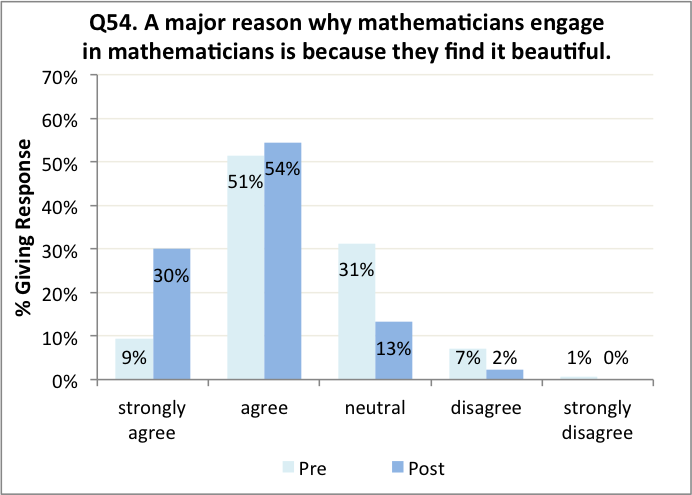
- A major reason why mathematicians engage in mathematicians is because they find it beautiful. (.678)
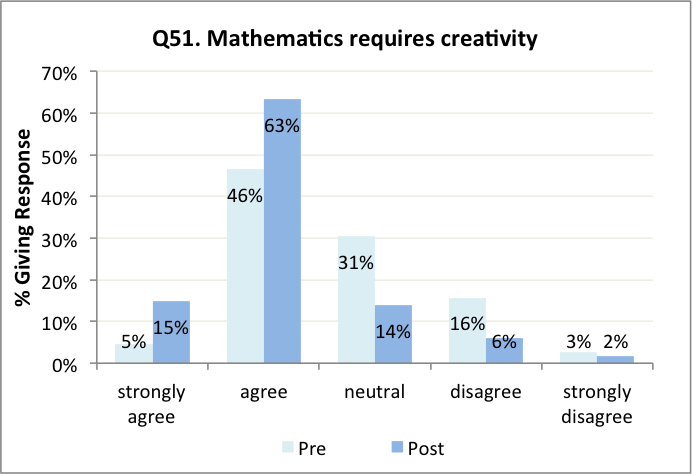
- Mathematics requires creativity. (.579)
- Doing mathematics for its own sake is as valuable as composing music, creating art, or other intellectual endeavors. (.500)
- Mathematics requires curiosity. (.473)
- There are debates within mathematics. (.466)
- Mathematics is mostly a tool for the sciences. (-.414)
- Mathematicians are excited and passionate about their work. (.412)
- Can you name one mathematician, who is still alive and describe what you think he/she does? (1.114)
- Can you name or describe a famous unsolved or recently solved problem in mathematics? (1.227)
- Can you name or describe a surprising mathematical aspect of or idea in, your personal environment that you have noticed outside of your mathematics class? (.663)
Student Thinking about Mathematics (Goals 5 & 7)

- I don’t think mathematics can be beautiful. (-.650)
- I am able to understand and critique written or spoken mathematical arguments. (.581)
- My thoughts and ideas matter when solving a mathematical problem. (.520)
- Thoughts and ideas that come to me while working on mathematical problems will often get me closer to a solution. (.479)
- I learn mathematics best when I explain ideas to other students. (.426)
Students Feelings about Mathematics (Goals 8 & 9)
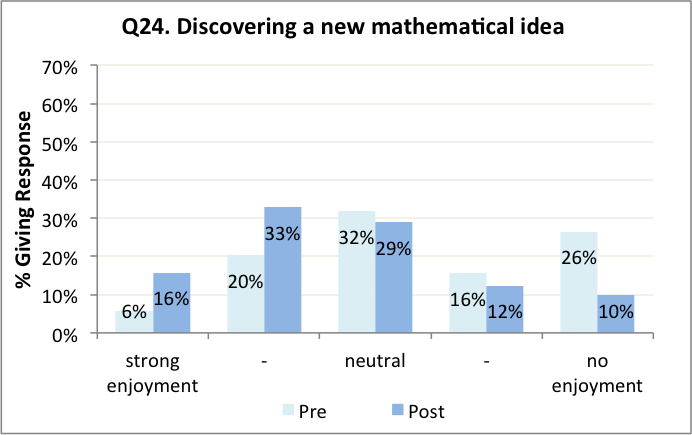
- Discovering a new mathematical idea. (.591)
- I don’t think doing mathematics is interesting. (-.538)
- Using rigorous reasoning in a math problem. (.511)
- Working on a challenging mathematical problem (How much do you enjoy…) (.460)
Changes associated with participation (Goals 6, 10, & 11)
Students self-report an increase in their ability to
- think and reason more effectively (87%),
- express themselves clearly when talking (74%),
- express themselves in writing (70%),
- read and understand mathematical problems (79%).
In addition, students report an increase in
- their curiosity about the world around them (72%),
- their awareness of how they approach and solve problems (80%),
- their sense of empowerment as a learner (70%),
- their confidence in their ability to take responsibility for their own learning (72%).
Detailed Description of the Study
From the fall of 2013 through the spring of 2016, students at Westfield State University taking MLA courses using IBL have been asked to take a pair of surveys, one at the beginning and one at the end of the semester, designed to examine the changes in students’ attitudes to mathematics. In a couple of cases, we were also able to collect surveys from classes outside of WSU, particularly from Drs. Xiao and Schumacher in the fall of 2015 and Dr. Rossa in the fall of 2013.
The surveys were developed collaboratively by the evaluators and the project team. The two surveys were mostly the same, though a set of additional items about the impact of the course were included on the post survey . The study includes about 630 students overall, with about 440 matched responses. Analyses were run for both MATCHED and UNMATCHED data sets. The results for significance levels and effect sizes turned out to be very similar. The matched analysis only includes responses from students who submitted both the pre- and post-survey and whom we were able to successfully identify on both surveys. The tests run were paired-samples t-tests, comparing the pre- and post-survey responses on an individual basis. The unmatched analysis is based on responses from all students who responded to the surveys, regardless of whether they took both surveys or not. For these data, we used independent-samples t-tests, comparing the surveys as separate groups.
Different scales were used for the different questions shown. These scales were as follows:
For Q1-22, Q50-63, we have an Agreement scale: 1 = strongly disagree, 2 = disagree, 3 = neutral, 4 = agree, 5 = strongly agree.
For Q26-Q30, Q31-Q49, we have a Yes/No scale: 0 = no, 1 = yes.
For Q23-Q25, we have an Enjoyment scale: 1 = no enjoyment, 3 = neutral, 5 = strong enjoyment.
The formula used to calculate the effect size is
(MEAN 1 - MEAN 2) / SQRT ( (((N1 - 1)*STANDDEV1^2) + ((N2 - 1)*STANDDEV2^2))/(N1+N2-2) )
Student Demographics (Matched)
Female: 250, Male: 198.
African American or Black: 37, Asian: 8, Hispanic, Latino, or Chicano: 29, Native American or Alaska Native: 8, White: 387, Other: 4.
Freshman/First Year: 199, Sophomore/Second Year: 150, Junior/Third Year: 60, Senior: 37.